extra_ds_tools.plots.eda
Module Contents
Functions
|
Creates a stripboxplot with extra informative ticks. Use fig.set_figheight() and/or fig.set_figwidth if labels are unreadable. |
Generates the histogram-, probability- and boxplot of different transformations of the values. |
|
Adds a histogram-, probabilty and boxplot to the axes. |
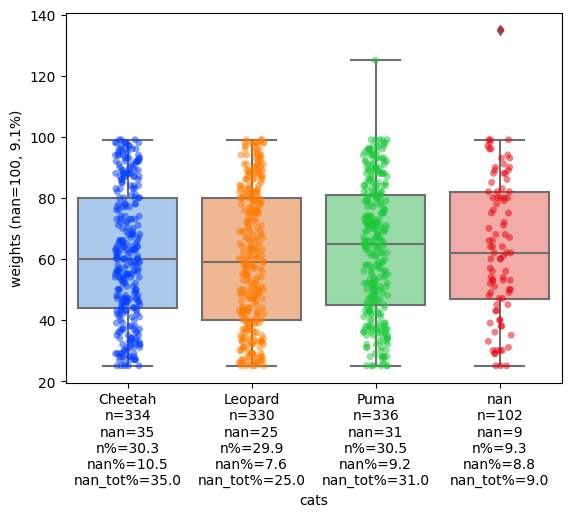
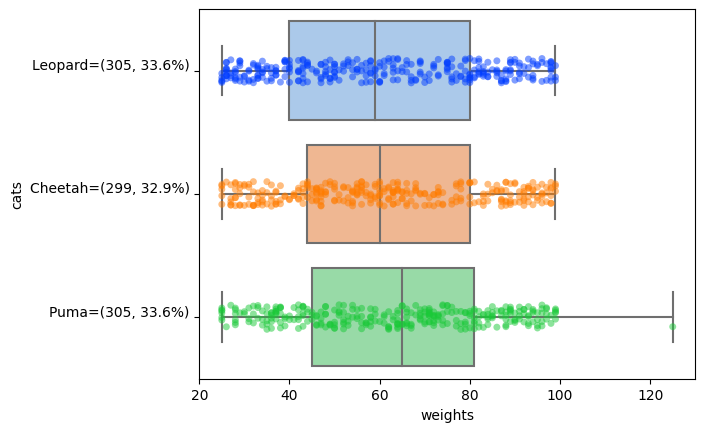
- extra_ds_tools.plots.eda.stripboxplot(df: pandas.DataFrame, cat_col: str, num_col: str, horizontal: bool = False, dropna: bool = False, count_info: bool = True, show_outliers: bool = True, show_legend: bool = False, sort_by_median: bool = False) Tuple[matplotlib.pyplot.Figure, matplotlib.pyplot.Axes]
Creates a stripboxplot with extra informative ticks. Use fig.set_figheight() and/or fig.set_figwidth if labels are unreadable.
- Parameters
df (pd.DataFrame) – The DataFrame with the data.
cat_col (str) – Column name with categorical/str values or a few numerical.
num_col (str) – Column name with the numerical values.
horizontal (bool, optional) – Plot the stripboxplot horizontally, by default False
dropna (bool, optional) – Drop na’s, by default False
count_info (bool, optional) – Have extra count information on the ticks, by default True
show_outliers (bool, optional) – Show outliers according to Seaborn’s boxplot, by default True
show_legend (bool, optional) – Show legend, by default False
sort_by_median (bool, optional) – Orders the cat_col by median, by default False
- Returns
Figure and Axes with the stripboxplot.
- Return type
Tuple[plt.Figure, plt.Axes]
Examples
>>> from numpy.random import default_rng
>>> import pandas as pd
>>> import numpy as np
# generate data
>>> rng = default_rng(42)
>>> cats = ['Cheetah', 'Leopard', 'Puma']
>>> cats = rng.choice(cats, size=1000)
>>> cats = np.append(cats, [None]*102)
>>> weights = rng.integers(25, 100, size=1000)
>>> weights = np.append(weights, [np.nan]*100)
>>> weights = np.append(weights, np.array([125,135]))
>>> rng.shuffle(cats)
>>> rng.shuffle(weights)
>>> df = pd.DataFrame({'cats': cats, 'weights': weights})
>>> fig, ax = stripboxplot(df, 'cats', 'weights')
>>> fig
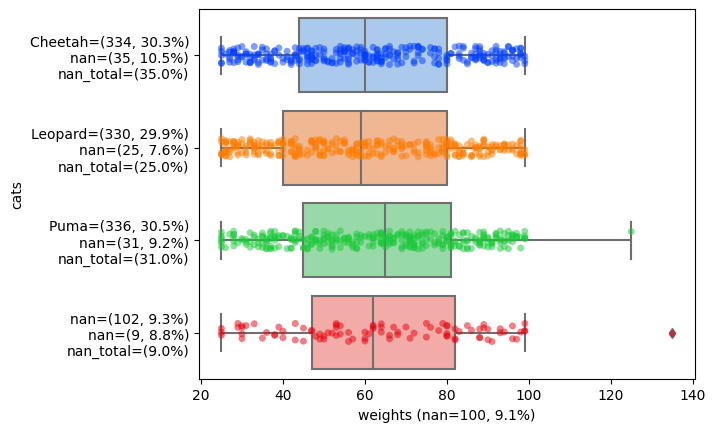
Change to horizontal:
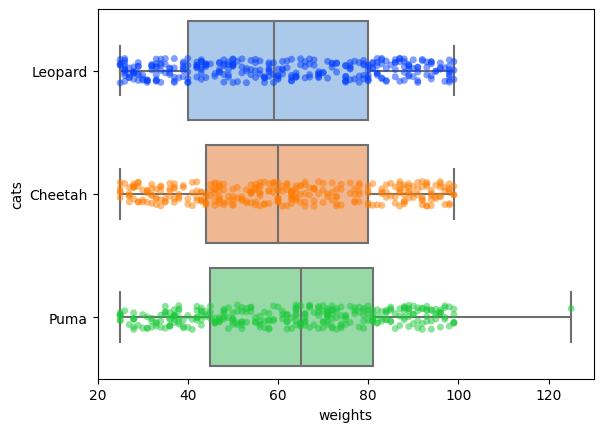
>>> fig, ax = stripboxplot(df, 'cats', 'weights', horizontal=True)
>>> fig
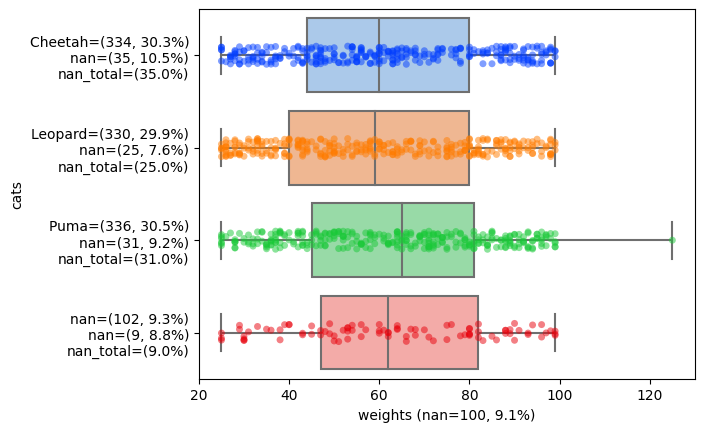
>>> fig, ax = stripboxplot(df, 'cats', 'weights', horizontal=True, show_outliers=False)
>>> fig
Remove outliers:
>>> fig, ax = stripboxplot(df, 'cats', 'weights', horizontal=True, show_outliers=False, dropna=True)
>>> fig
Drop na statistics:
Drop extra count info:
>>> fig, ax = stripboxplot(df, 'cats', 'weights', count_info = False, horizontal=True, show_outliers=False, dropna=True)
>>> fig
See also
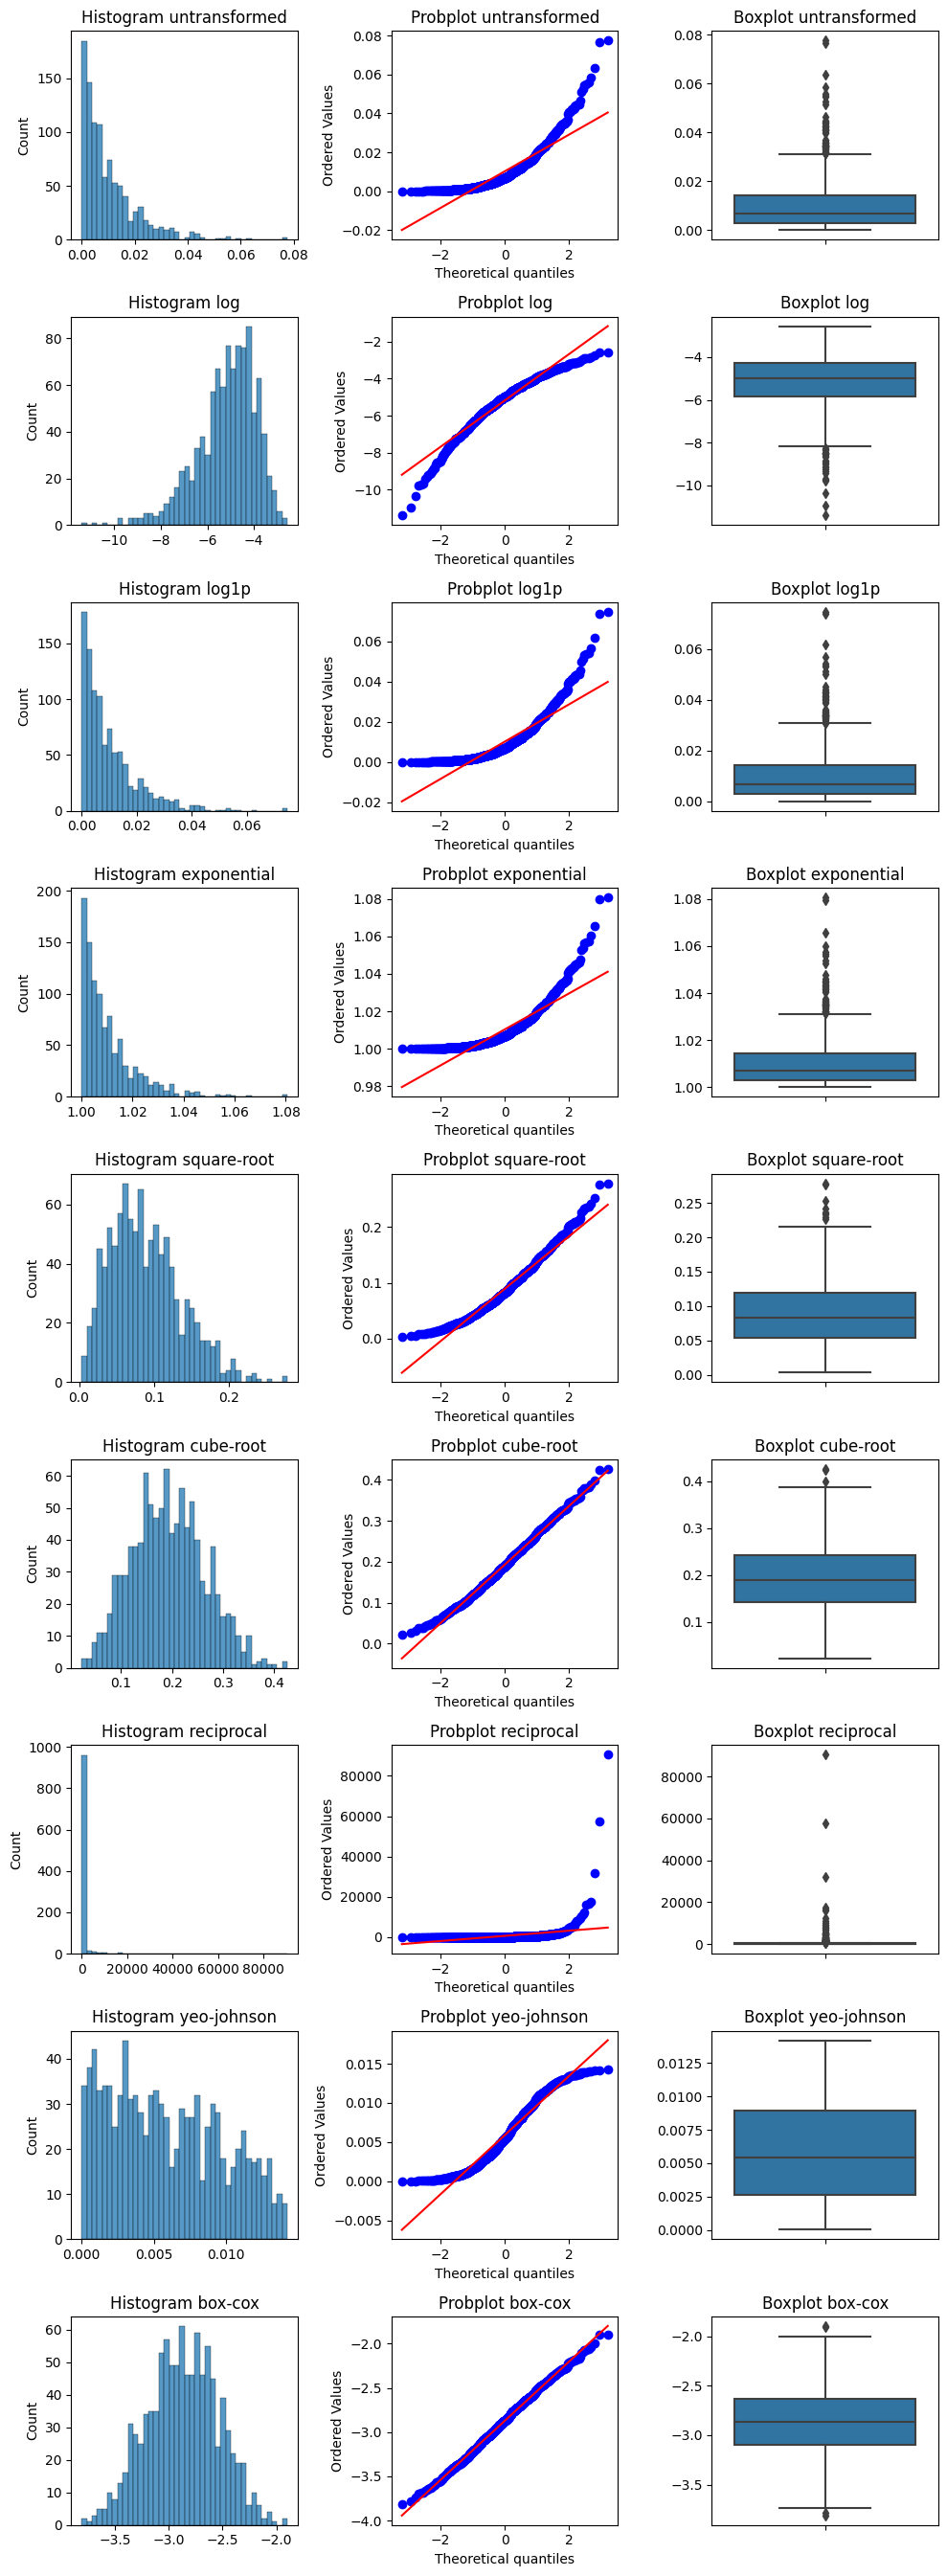
- extra_ds_tools.plots.eda.try_diff_distribution_plots(values: numpy.typing.NDArray[numpy.float64], hist_bins: int = 30) Tuple[matplotlib.pyplot.Figure, List[matplotlib.pyplot.Axes], Dict[str, numpy.typing.NDArray[numpy.float64]]]
Generates the histogram-, probability- and boxplot of different transformations of the values.
- Parameters
values (NDArray[np.float64]) – A list or numpy array of floats.
hist_bins (int, optional) – Amount of bins for the histogram, by default 30
- Returns
Returns the figure, the axes with the plots and the transformed values with the transformation title.
- Return type
Tuple[plt.Figure, List[plt.Axes], Dict[str, NDArray[np.float64]]]
Examples
>>> from numpy.random import default_rng
>>> rng = default_rng(42)
>>> values = rng.pareto(a=100, size=1000)
>>> fig, axes, transformed_values = try_diff_distribution_plots(values, hist_bins=40)
>>> print(transformed_values.keys())
dict_keys(['untransformed', 'log', 'log1p', 'exponential', 'square-root', 'cube-root', 'reciprocal', 'yeo-johnson', 'box-cox'])
>>> print(transformed_values['log'][:2])
[-3.71590427 -3.74494525]
>>> fig
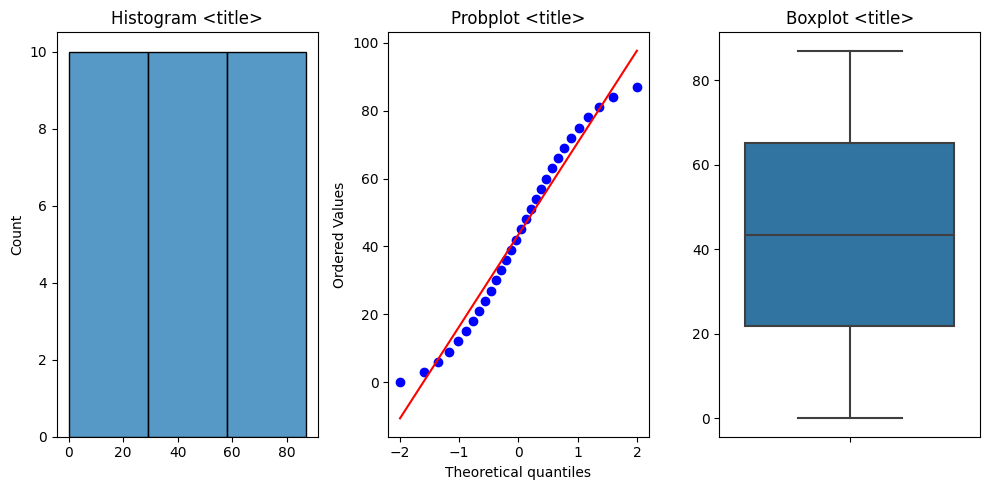
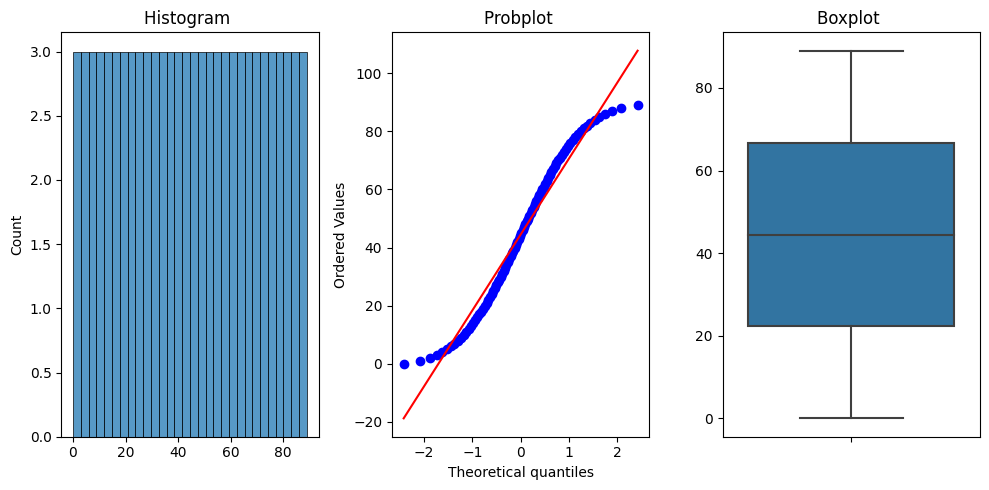
- extra_ds_tools.plots.eda.create_distribution_plots(values: numpy.typing.NDArray[numpy.float64], title: str = '', fig: matplotlib.pyplot.Figure = None, axes: List[matplotlib.pyplot.Axes] = None, row_index: int = 0, hist_bins: int = 30, tight_layout: bool = True) Tuple[matplotlib.pyplot.Figure, List[matplotlib.pyplot.Axes]]
Adds a histogram-, probabilty and boxplot to the axes.
- Parameters
values (NDArray[np.float64]) – Values to create the plots from.
title (str, optional) – Title of the plots, by default “”
fig (plt.Figure, optional) – A matplotlib Figure, by default None
axes (List[plt.Axes], optional) – Axes to draw to plots on, by default None
row_index (int, optional) – The row index of the axes for the plots to be added to, by default 0
hist_bins (int, optional) – Amount of bins for the histogram, by default 30
tight_layout (bool, optional) – Automatically prettifies the layout of the Figure. Not recommended when give a Figure and Axes as arguments, by default True
- Returns
The figure and the axes, with a histogram-, probability- and boxplot.
- Return type
Tuple[plt.Figure, List[plt.Axes]]
Examples
>>> fig, axes = create_distribution_plots(list(range(90)))
>>> fig
>>> fig, axes = create_distribution_plots(list(range(0,90,3)), title="<title>", hist_bins=3)
>>> fig