extra_ds_tools.plots.format
Module Contents
Functions
|
Adds count statistics to y ticks on a matplotlib Figure. |
|
Adds count statistics to x ticks on a matplotlib Figure. |
- extra_ds_tools.plots.format.add_counts_to_yticks(fig: matplotlib.pyplot.Figure, ax: matplotlib.pyplot.Axes, df: pandas.DataFrame, x_col: str, y_col: str, dropna: bool = False) Tuple[matplotlib.pyplot.Figure, matplotlib.pyplot.Axes]
Adds count statistics to y ticks on a matplotlib Figure.
- Parameters
fig (plt.Figure) – The matplotlib Figure.
ax (plt.Axes) – The matplotlib Axes to add the count information to.
df (pd.DataFrame) – The pandas DataFrame with the data of the plot.
x_col (str) – Name of the column with the values on the x-axis.
y_col (str) – Name of the column with the values on the y-axis.
dropna (bool, optional) – Whether to drop count statistics about na values, by default False
- Returns
Returns the Figure and Axes with the added count statistics.
- Return type
Tuple[plt.Figure, plt.Axes]
Examples
>>> from numpy.random import default_rng
>>> import matplotlib.pyplot as plt
>>> import seaborn as sns
>>> import pandas as pd
>>> import numpy as np
# generate data
>>> rng = default_rng(42)
>>> cats = ['Cheetah', 'Leopard', 'Puma']
>>> cats = rng.choice(cats, size=1000)
>>> cats = np.append(cats, [None]*102)
>>> weights = rng.integers(25, 100, size=1000)
>>> weights = np.append(weights, [np.nan]*100)
>>> weights = np.append(weights, np.array([125,135]))
>>> rng.shuffle(cats)
>>> rng.shuffle(weights)
>>> df = pd.DataFrame({'cats': cats, 'weights': weights})
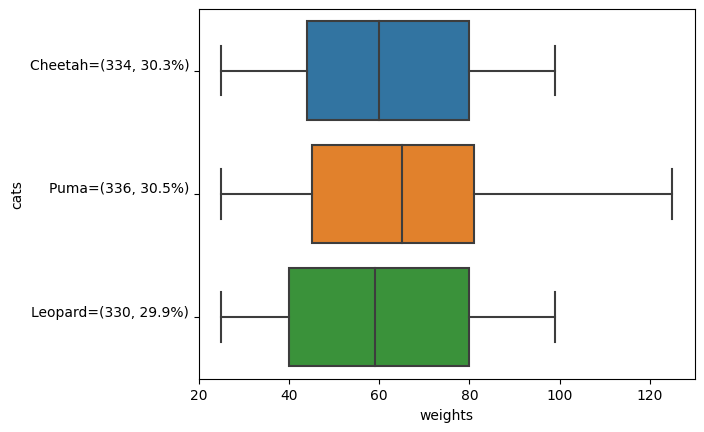
>>> fig, ax = plt.subplots()
>>> sns.boxplot(data=df, x='weights', y='cats', ax=ax)
>>> fig, ax = add_counts_to_ticks(fig, ax, df, 'weights', 'cats')
>>> fig
Drop na statistics:
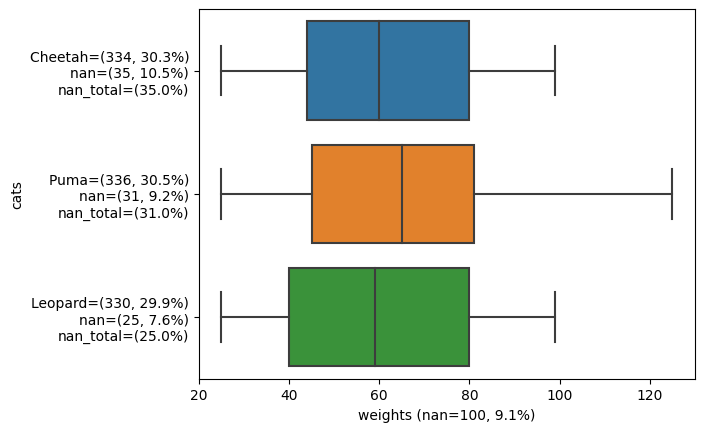
>>> fig, ax = plt.subplots()
>>> sns.boxplot(data=df, x='weights', y='cats', ax=ax)
>>> fig, ax = add_counts_to_yticks(fig, ax, df, 'weights', 'cats', dropna=True)
>>> fig
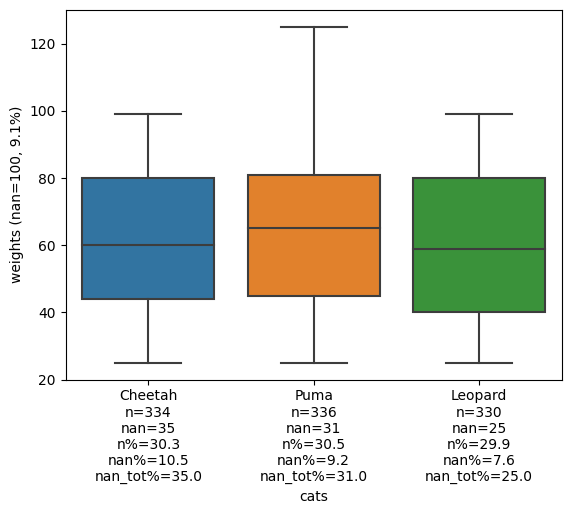
- extra_ds_tools.plots.format.add_counts_to_xticks(fig: matplotlib.pyplot.Figure, ax: matplotlib.pyplot.Axes, df: pandas.DataFrame, x_col: str, y_col: str, dropna: bool = False) Tuple[matplotlib.pyplot.Figure, matplotlib.pyplot.Axes]
Adds count statistics to x ticks on a matplotlib Figure.
- Parameters
fig (plt.Figure) – The matplotlib Figure.
ax (plt.Axes) – The matplotlib Axes to add the count information to.
df (pd.DataFrame) – The pandas DataFrame with the data of the plot.
x_col (str) – Name of the column with the values on the x-axis.
y_col (str) – Name of the column with the values on the y-axis.
dropna (bool, optional) – Whether to drop count statistics about na values, by default False
- Returns
Returns the Figure and Axes with the added count statistics.
- Return type
Tuple[plt.Figure, plt.Axes]
Examples
>>> from numpy.random import default_rng
>>> import matplotlib.pyplot as plt
>>> import seaborn as sns
>>> import pandas as pd
>>> import numpy as np
# generate data
>>> rng = default_rng(42)
>>> cats = ['Cheetah', 'Leopard', 'Puma']
>>> cats = rng.choice(cats, size=1000)
>>> cats = np.append(cats, [None]*102)
>>> weights = rng.integers(25, 100, size=1000)
>>> weights = np.append(weights, [np.nan]*100)
>>> weights = np.append(weights, np.array([125,135]))
>>> rng.shuffle(cats)
>>> rng.shuffle(weights)
>>> df = pd.DataFrame({'cats': cats, 'weights': weights})
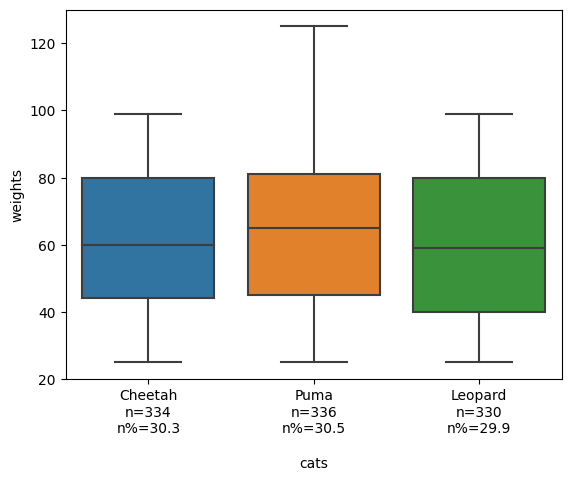
>>> fig, ax = plt.subplots()
>>> sns.boxplot(data=df, x='cats', y='weights', ax=ax)
>>> fig, ax = add_counts_to_xticks(fig, ax, df, 'cats', 'weights')
>>> fig
Drop na statistics:
>>> fig, ax = plt.subplots()
>>> sns.boxplot(data=df, x='weights', y='cats', ax=ax)
>>> fig, ax = add_counts_to_xticks(fig, ax, df, 'weights', 'cats', dropna=True)
>>> fig